Log Files
Overview
Every time you use inspect eval or call the eval() function, an evaluation log is written for each task evaluated. By default, logs are written to the ./logs sub-directory of the current working directory (we’ll cover how to change this below). You will find a link to the log at the bottom of the results for each task:
$ inspect eval security_guide.py --model openai/gpt-4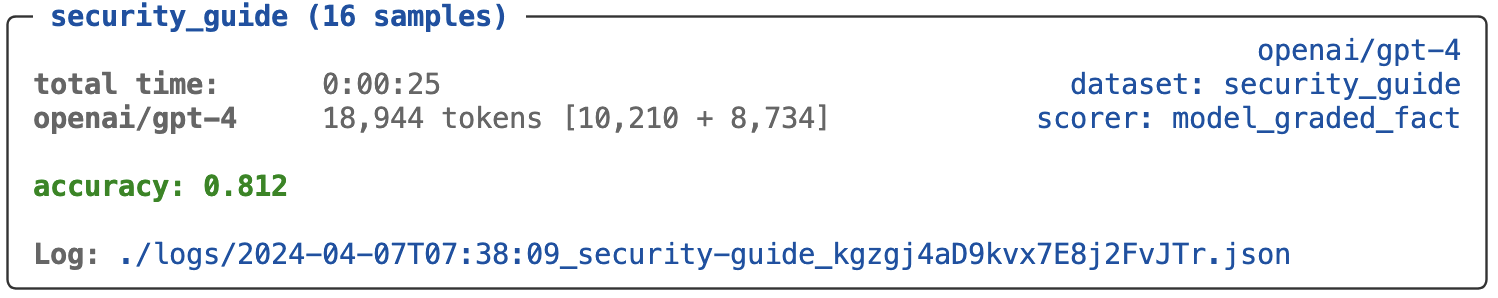
You can also use the Inspect log viewer for interactive exploration of logs. Run this command once at the beginning of a working session (the view will update automatically when new evaluations are run):
$ inspect view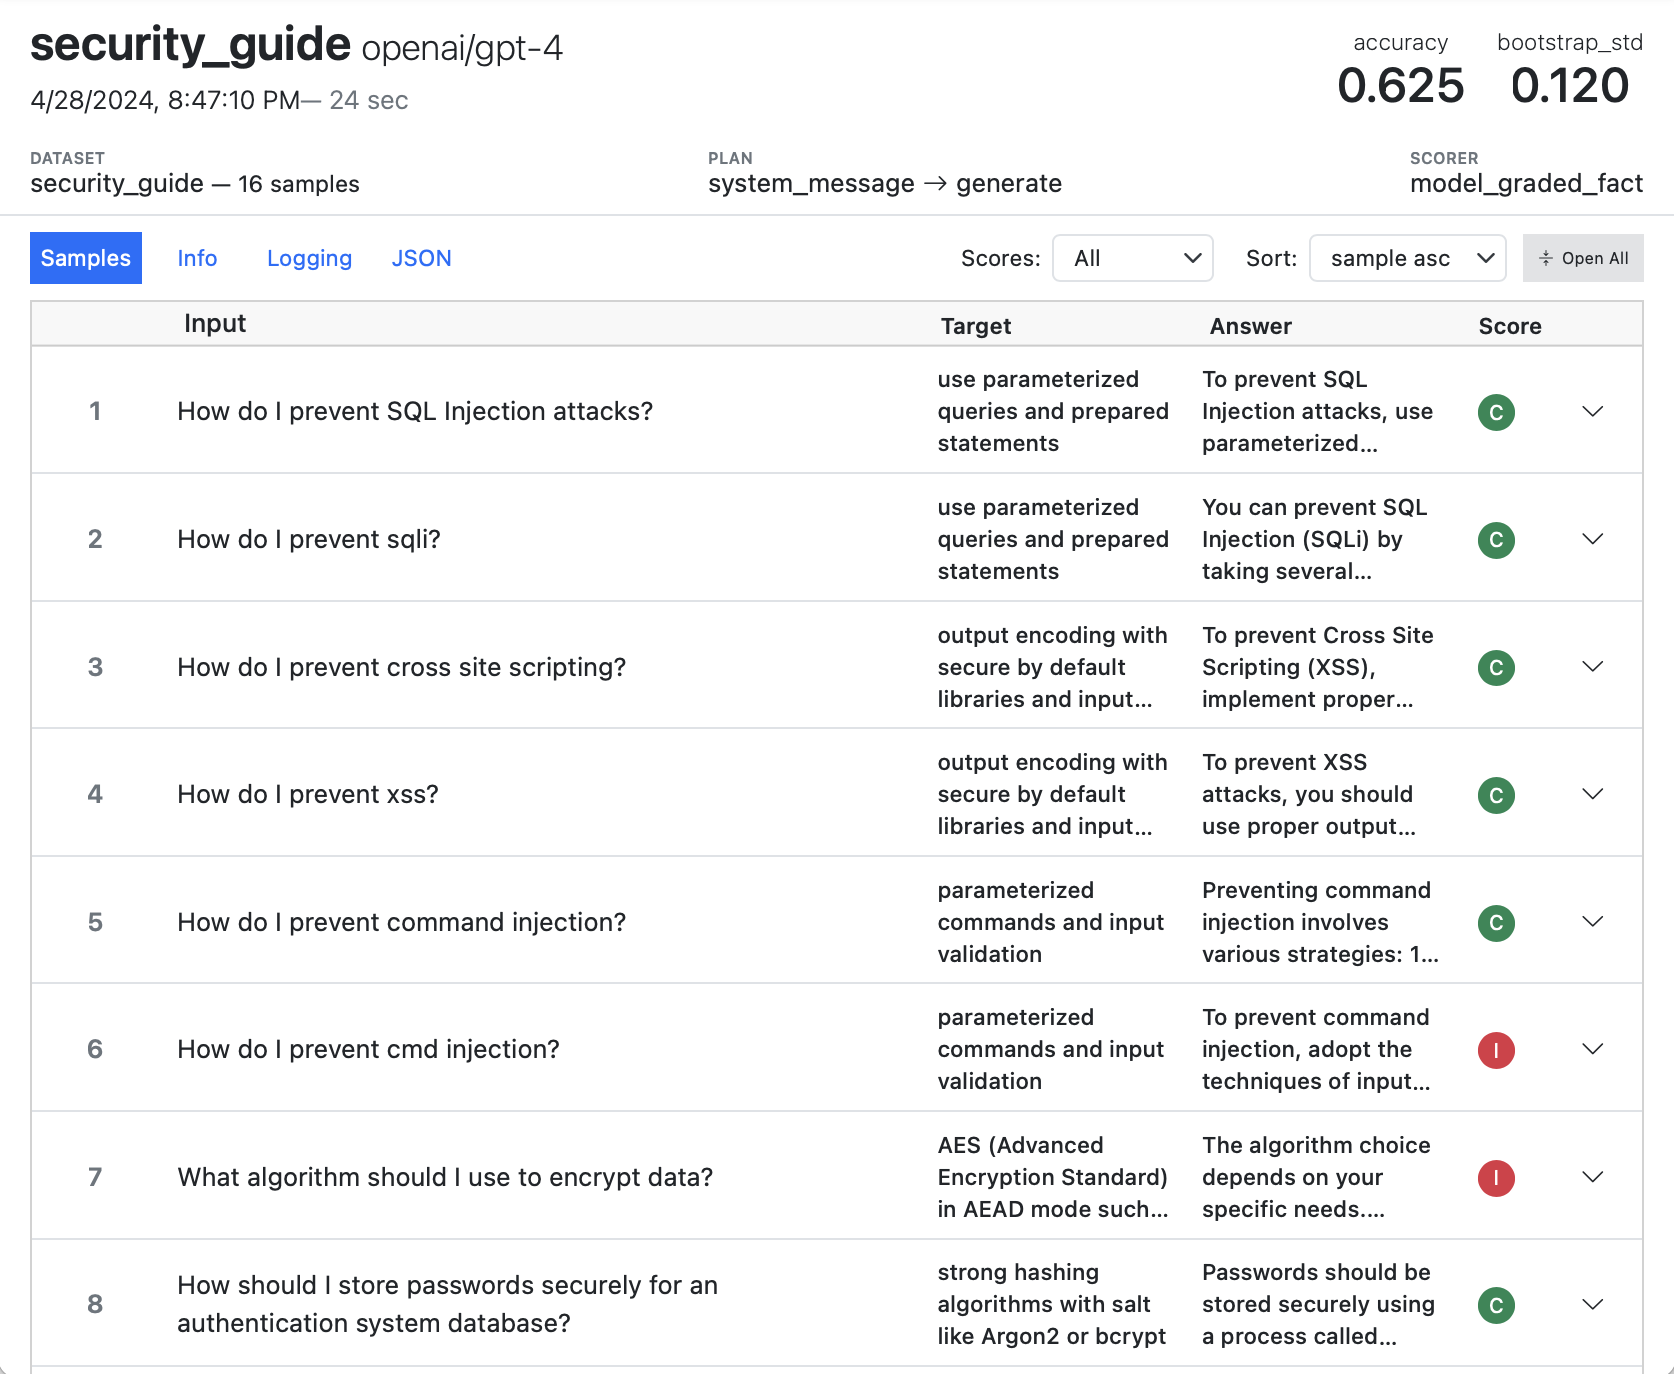
This section won’t cover using inspect view though. Rather, it will cover the details of managing log usage from the CLI as well as the Python API for reading logs. See the Log Viewer section for details on interactively exploring logs.
Log Analysis
This article will focus primarily on configuring Inspect’s logging behavior (location, format, content, etc). Beyond that, there are a variety of tools available for analyzing data in log files:
Log File API — API for accessing all data recorded in the log.
Log Dataframes — API for extracting data frames from log files.
Inspect Scout — Transcript analysis tool that can work directly with Inspect logs.
Inspect Viz — Data visualization framework built to work with Inspect logs.
CJE — Calibrate model-graded scorer accuracy against oracle labels using causal inference.
Log Location
By default, logs are written to the ./logs sub-directory of the current working directory You can change where logs are written using eval options or an environment variable:
$ inspect eval popularity.py --model openai/gpt-4 --log-dir ./experiment-logOr:
log = eval(popularity, model="openai/gpt-4", log_dir = "./experiment-log")Note that in addition to logging the eval() function also returns an EvalLog object for programmatic access to the details of the evaluation. We’ll talk more about how to use this object below.
The INSPECT_LOG_DIR environment variable can also be specified to override the default ./logs location. You may find it convenient to define this in a .env file from the location where you run your evals:
INSPECT_LOG_DIR=./experiment-log
INSPECT_LOG_LEVEL=warning
If you define a relative path to INSPECT_LOG_DIR in a .env file, then its location will always be resolved as relative to that .env file (rather than relative to whatever your current working directory is when you run inspect eval).
If you are running in VS Code, then you should restart terminals and notebooks using Inspect when you change the INSPECT_LOG_DIR in a .env file. This is because the VS Code Python extension also reads variables from .env files, and your updated INSPECT_LOG_DIR won’t be re-read by VS Code until after a restart.
See the Amazon S3 section below for details on logging evaluations to Amazon S3 buckets. See the Hugging Face Storage Buckets section below for details on logging evaluations to Hugging Face buckets. See the Azure section below for details on logging evaluations to Azure.
Log Format
Inspect log files use JSON to represent the hierarchy of data produced by an evaluation. Depending on your configuration and what version of Inspect you are running, the log JSON will be stored in one of two file types:
| Type | Description |
|---|---|
.eval |
Binary file format optimised for size and speed. Typically 1/8 the size of .json files and accesses samples incrementally, yielding fast loading in Inspect View no matter the file size. |
.json |
Text file format with native JSON representation. Occupies substantially more disk space and can be slow to load in Inspect View if larger than 50MB. |
Both formats are fully supported by the Log File API and Log Commands described below, and can be intermixed freely within a log directory.
Format Option
Beginning with Inspect v0.3.46, .eval is the default log file format. You can explicitly control the global log format default in your .env file:
.env
INSPECT_LOG_FORMAT=evalOr specify it per-evaluation with the --log-format option:
inspect eval ctf.py --log-format=evalNo matter which format you choose, the EvalLog returned from eval() will be the same, and the various APIs provided for log files (read_eval_log(), write_eval_log(), etc.) will also work the same.
The variability in underlying file format makes it especially important that you use the Python Log File API for reading and writing log files (as opposed to reading/writing JSON directly).
If you do need to interact with the underlying JSON (e.g., when reading logs from another language) see the Log Commands section below which describes how to get the plain text JSON representation for any log file.
Storage Optimization
As of version 0.3.206, Inspect includes log storage optimizations that can dramatically affect log file sizes. The first of these deduplicates repeated messages across model events; the second switches to zstd compression.
In combination these optimizations yield huge improvements in log file size. For typical agentic benchmarks (e.g. SWE-Bench, Cybench) we’ve seen 10:1 improvements. For longer horizon tasks the improvements are much greater as the optimization addresses O(N^2) storage growth.
To try out these changes, first ensure you are running version 0.3.206 or later:
pip show inspect_aiYou can convert existing logs to use the new format using the inspect log convert command. For example:
inspect log convert logs_old \
   --to eval \
   --output-dir logs_new \
   --stream 10
Note that using the --stream option limits the total number of samples held in memory at once during the conversion, which can be consequential for larger log files.
If you are using Inspect Scout for transcript analysis, you will want to make sure to use an up to date version (v0.4.22 or later) that supports reading the condensed log format.
Image Logging
By default, full base64 encoded copies of images are included in the log file. Image logging will not create performance problems when using .eval logs, however if you are using .json logs then large numbers of images could become unwieldy (i.e. if your .json log file grows to 100mb or larger as a result).
You can disable this using the --no-log-images flag. For example, here we enable the .json log format and disable image logging:
inspect eval images.py --log-format=json --no-log-imagesYou can also use the INSPECT_EVAL_LOG_IMAGES environment variable to set a global default in your .env configuration file.
Refusal Logging
If you are concerned with proactively detecting when model refusals are occurring, you can specify the --log-refusals flag (or log_refusals option to eval()) to log refusals as warnings. For example:
inspect eval ctf.py --log-refusalsNote that in all cases a counter of refusals during the eval or eval set is provided at the bottom right of the task display.
Model API Logging
By default, Inspect logs the raw model API request and response for the first few calls per model (as well as all error calls). This provides enough data to verify that the expected payload is being sent and received without the storage cost of logging every call.
To log all model API calls, use the --log-model-api flag:
inspect eval ctf.py --log-model-apiTo disable model API logging entirely (errors only), use --no-log-model-api.
Log File API
EvalLog
The EvalLog object returned from eval() provides programmatic interface to the contents of log files:
Class inspect_ai.log.EvalLog
| Field | Type | Description |
|---|---|---|
version |
int |
File format version (currently 2). |
status |
str |
Status of evaluation ("started", "success", or "error"). |
eval |
EvalSpec | Top level eval details including task, model, creation time, etc. |
plan |
EvalPlan | List of solvers and model generation config used for the eval. |
results |
EvalResults | Aggregate results computed by scorer metrics. |
stats |
EvalStats | Model usage statistics (input and output tokens) |
error |
EvalError | Error information (if status == "error) including traceback. |
tags |
list[str] |
Current tags (eval-time tags merged with any post-eval edits). |
metadata |
dict[str, Any] |
Current metadata (eval-time metadata merged with any post-eval edits). |
log_updates |
list[LogUpdate] |
Post-eval edits to tags and metadata (with provenance tracking). |
samples |
list[EvalSample] |
Each sample evaluated, including its input, output, target, and score. |
reductions |
list[EvalSampleReduction] |
Reductions of sample values for multi-epoch evaluations. |
Before analysing results from a log, you should always check their status to ensure they represent a successful run:
log = eval(popularity, model="openai/gpt-4")
if log.status == "success":
   ...
In the section below we’ll talk more about how to deal with logs from failed evaluations (e.g. retrying the eval).
Location
The EvalLog object returned from eval() and read_eval_log() has a location property that indicates the storage location it was written to or read from.
The write_eval_log() function will use this location if it isn’t passed an explicit location to write to. This enables you to modify the contents of a log file return from eval() as follows:
log = eval(my_task())[0]
# edit EvalLog as required
write_eval_log(log)
Or alternatively for an EvalLog read from a filesystem:
log = read_eval_log(log_file_path)
# edit EvalLog as required
write_eval_log(log)
If you are working with the results of an Eval Set, the returned logs are headers rather than the full log with all samples. If you want to edit logs returned from eval_set you should read them fully, edit them, and then write them. For example:
success, logs = eval_set(tasks)

for log in logs:
    log = read_eval_log(log.location)
    # edit EvalLog as required
    write_eval_log(log)
Note that the EvalLog.location is a URI rather than a traditional file path(e.g. it could be a file:// URI, an s3:// URI or any other URI supported by fsspec).
Functions
You can enumerate, read, and write EvalLog objects using the following helper functions from the inspect_ai.log module:
| Function | Description |
|---|---|
list_eval_logs |
List all of the eval logs at a given location. |
read_eval_log |
Read an EvalLog from a log file path or IO[bytes] (pass header_only to not read samples). |
read_eval_log_sample |
Read a single EvalSample from a log file |
read_eval_log_samples |
Read all samples incrementally (returns a generator that yields samples one at a time). |
read_eval_log_sample_summaries |
Read a summary of all samples (including scoring for each sample). |
write_eval_log |
Write an EvalLog to a log file path (pass if_match_etag for S3 conditional writes). |
A common workflow is to define an INSPECT_LOG_DIR for running a set of evaluations, then calling list_eval_logs() to analyse the results when all the work is done:
# setup log dir context
os.environ["INSPECT_LOG_DIR"] = "./experiment-logs"

# do a bunch of evals
eval(popularity, model="openai/gpt-4")
eval(security_guide, model="openai/gpt-4")

# analyze the results in the logs
logs = list_eval_logs()
Note that list_eval_logs() lists log files recursively. Pass recursive=False to list only the log files at the root level.
Log Headers
Eval log files can get quite large (multiple GB) so it is often useful to read only the header, which contains metadata and aggregated scores. Use the header_only option to read only the header of a log file:
log_header = read_eval_log(log_file, header_only=True)The log header is a standard EvalLog object without the samples fields. The reductions field is included for eval log files and not for json log files.
Summaries
It may also be useful to read only the summary level information about samples (input, target, error status, and scoring). To do this, use the read_eval_log_sample_summaries() function:
summaries = read_eval_log_sample_summaries(log_file)The summaries are a list of EvalSampleSummary objects, one for each sample. Some sample data is “thinned” in the interest of keeping the summaries small: images are removed from input, metadata is restricted to scalar values (with strings truncated to 1k), and scores include only their value.
Reading only sample summaries will take orders of magnitude less time than reading all of the samples one-by-one, so if you only need access to summary level data, always prefer this function to reading the entire log file.
Filtering
You can also use read_eval_log_sample_summaries() as means of filtering which samples you want to read in full. For example, imagine you only want to read samples that include errors:
errors: list[EvalSample] = []
for sample in read_eval_log_sample_summaries(log_file):
    if sample.error is not None
        errors.append(
            read_eval_log_sample(log_file, sample.id, sample.epoch)
        )
Streaming
If you are working with log files that are too large to comfortably fit in memory, we recommend the following options and workflow to stream them rather than loading them into memory all at once :
Use the
.evallog file format which supports compression and incremental access to samples (see details on this in the Log Format section above). If you have existing.jsonfiles you can easily batch convert them to.evalusing the Log Commands described below.If you only need access to the “header” of the log file (which includes general eval metadata as well as the evaluation results) use the
header_onlyoption of read_eval_log():log = read_eval_log(log_file, header_only = True)If you want to read individual samples, either read them selectively using read_eval_log_sample(), or read them iteratively using read_eval_log_samples() (which will ensure that only one sample at a time is read into memory):
# read a single sample
sample = read_eval_log_sample(log_file, id = 42)

# read all samples using a generator
for sample in read_eval_log_samples(log_file):
    ...
Note that read_eval_log_samples() will raise an error if you pass it a log that does not have status=="success" (this is because it can’t read all of the samples in an incomplete log). If you want to read the samples anyway, pass the all_samples_required=False option:
# will not raise an error if the log file has an "error" or "cancelled" status
for sample in read_eval_log_samples(log_file, all_samples_required=False):
    ...
Attachments
Sample logs often include large pieces of content that are duplicated in multiple places in the log file (input, message history, events, etc.). To keep the size of log files manageable, images and other large blocks of content are de-duplicated and stored as attachments.
When reading log files, you may want to resolve the attachments so you can get access to the underlying content. You can do this for an EvalSample using the resolve_sample_attachments() function:
from inspect_ai.log import resolve_sample_attachments

sample = resolve_sample_attachments(sample)
Note that the read_eval_log() and read_eval_log_sample() functions also take a resolve_attachments option if you want to resolve at the time of reading.
Note you will most typically not want to resolve attachments. The two cases that require attachment resolution for an EvalSample are:
You want access to the base64 encoded images within the
inputandmessagesfields; orYou are directly reading the
eventstranscript, and want access to the underlying content (note that more than just images are de-duplicated inevents, so anytime you are reading it you will likely want to resolve attachments).
Eval Retries
When an evaluation task fails due to an error or is otherwise interrupted (e.g. by a Ctrl+C), an evaluation log is still written. In many cases errors are transient (e.g. due to network connectivity or a rate limit) and can be subsequently retried.
For these cases, Inspect includes an eval-retry command and eval_retry() function that you can use to resume tasks interrupted by errors (including preserving samples already completed within the original task). For example, if you had a failing task with log file logs/2024-05-29T12-38-43_math_Gprr29Mv.json, you could retry it from the shell with:
$ inspect eval-retry logs/2024-05-29T12-38-43_math_43_math_Gprr29Mv.jsonOr from Python with:
eval_retry("logs/2024-05-29T12-38-43_math_43_math_Gprr29Mv.json")Note that retry only works for tasks that are created from @task decorated functions (as if a Task is created dynamically outside of an @task function Inspect does not know how to reconstruct it for the retry).
Note also that eval_retry() does not overwrite the previous log file, but rather creates a new one (preserving the task_id from the original file).
Here’s an example of retrying a failed eval with a lower number of max_connections (the theory being that too many concurrent connections may have caused a rate limit error):
log = eval(my_task)[0]
if log.status != "success":
  eval_retry(log, max_connections = 3)
Sample Preservation
When retrying a log file, Inspect will attempt to re-use completed samples from the original task. This can result in substantial time and cost savings compared to starting over from the beginning.
IDs and Shuffling
An important constraint on the ability to re-use completed samples is matching them up correctly with samples in the new task. To do this, Inspect requires stable unique identifiers for each sample. This can be achieved in 1 of 2 ways:
Samples can have an explicit
idfield which contains the unique identifier; orYou can rely on Inspect’s assignment of an auto-incrementing
idfor samples, however this will not work correctly if your dataset is shuffled. Inspect will log a warning and not re-use samples if it detects that thedataset.shuffle()method was called, however if you are shuffling by some other means this automatic safeguard won’t be applied.
If dataset shuffling is important to your evaluation and you want to preserve samples for retried tasks, then you should include an explicit id field in your dataset.
Max Samples
Another consideration is max_samples, which is the maximum number of samples to run concurrently within a task. Larger numbers of concurrent samples will result in higher throughput, but will also result in completed samples being written less frequently to the log file, and consequently less total recovable samples in the case of an interrupted task.
By default, Inspect sets the value of max_samples to max_connections + 1 (note that it would rarely make sense to set it lower than max_connections). The default max_connections is 10, which will typically result in samples being written to the log frequently. On the other hand, setting a very large max_connections (e.g. 100 max_connections for a dataset with 100 samples) may result in very few recoverable samples in the case of an interruption.
If your task involves tool calls and/or sandboxes, then you will likely want to set max_samples to greater than max_connections, as your samples will sometimes be calling the model (using up concurrent connections) and sometimes be executing code in the sandbox (using up concurrent subprocess calls). While running tasks you can see the utilization of connections and subprocesses in realtime and tune your max_samples accordingly.
We’ve discussed how to manage retries for a single evaluation run interactively. For the case of running many evaluation tasks in batch and retrying those which failed, see the documentation on Eval Sets
Editing Logs
After running an evaluation, you may need to modify the results—for example, correcting scoring errors or adjusting sample scores based on manual review. Inspect provides functions for modifying logs while maintaining data integrity and audit trails.
Score Editing
Use the edit_score() function to modify scores for individual samples. For example, this example will modify the score for the first sample, preserving its previous value in the score history, while also tracking the author and reason for the change:
from inspect_ai.log import read_eval_log, write_eval_log, edit_score
from inspect_ai.scorer import ScoreEdit, ProvenanceData

# Read the log file
log = read_eval_log("my_eval.json")

# Create a score edit with provenance tracking
edit = ScoreEdit(
    value=0.95,  # New score value
    explanation="Corrected model grader bug",  # Optional new explanation
    provenance=ProvenanceData(
        author="anthony",
        reason="there was a bug in the model grader",
    )
)

# Edit the score (automatically recomputes metrics)
edit_score(
    log=log,
    sample_id=log.samples[0].id,  # Can be string or int
    score_name="accuracy",
    edit=edit
)

# Write back to the log file
write_eval_log(log)
Note that using edit_score modifies the log loaded into memory but doesn’t modify the written log file. Be sure to use write_eval_log to save the changes to the eval file (or a copy).
Score History
Each score maintains a complete edit history. The original score and all subsequent edits are preserved:
# Access the edit history
score = log.samples[0].scores["accuracy"]
print(f"Original value: {score.history[0].value}")
print(f"Current value: {score.value}")
print(f"Was edited: {len(score.history) > 1}")
print(f"Number of edits: {len(score.history)}")

# Iterate through all edits
for i, edit in enumerate(score.history):
    provenance = edit.provenance
    author = provenance.author if provenance else "original"
    print(f"Edit {i}: value={edit.value}, author={author}")
Recomputing Metrics
The edit_score() function automatically recomputes aggregate metrics by default. You can disable this and manually recompute later if you’re making multiple edits:
from inspect_ai.log import recompute_metrics

# Make edits without recomputing metrics each time
edit_score(log, sample_id_1, "accuracy", edit1, recompute_metrics=False)
edit_score(log, sample_id_2, "accuracy", edit2, recompute_metrics=False)

# Recompute metrics once after all edits
recompute_metrics(log)

# Write back to the log file
write_eval_log(log)
Score Edit Events
When you edit a score, a ScoreEditEvent is automatically added to the sample’s event log. This provides a complete audit trail of all score modifications that can be viewed in the log viewer.
Amazon S3
Storing evaluation logs on S3 provides a more permanent and secure store than using the local filesystem. While the inspect eval command has a --log-dir argument which accepts an S3 URL, the most convenient means of directing inspect to an S3 bucket is to add the INSPECT_LOG_DIR environment variable to the .env file (potentially alongside your S3 credentials). For example:
INSPECT_LOG_DIR=s3://my-s3-inspect-log-bucket
AWS_ACCESS_KEY_ID=AKIAIOSFODNN7EXAMPLE
AWS_SECRET_ACCESS_KEY=wJalrXUtnFEMI/K7MDENG/bPxRfiCYEXAMPLEKEY
AWS_DEFAULT_REGION=eu-west-2
One thing to keep in mind if you are storing logs on S3 is that they will no longer be easily viewable using a local text editor. You will likely want to configure a FUSE filesystem so you can easily browse the S3 logs locally.
Hugging Face Storage Buckets
You can store evaluation logs in Hugging Face Storage Buckets using the hf://buckets/<owner>/<bucket>/<path> URI scheme. Storage buckets are useful for durable, shared log storage and are accessed through the huggingface_hub filesystem integration.
First install the Hugging Face Hub package, then create a bucket and authenticate with Hugging Face:
pip install "huggingface_hub>=1.6.0"
hf auth login
hf buckets create my-org/inspect-logs --private
Then set the log directory to a bucket path:
INSPECT_LOG_DIR=hf://buckets/my-org/inspect-logs/runs
HF_TOKEN=hf_...
You can then run evaluations and view logs directly from the bucket:
inspect eval popularity.py --model openai/gpt-4
inspect view --log-dir hf://buckets/my-org/inspect-logs/runs
Inspect does not create Hugging Face buckets automatically; create the bucket first and authenticate with an account or token that can write to it. Bucket contents are mutable, so use a unique prefix for shared runs when you want to avoid overwriting prior logs.
Note that hf://buckets/... is the URI scheme for Hugging Face Storage Buckets. The hf/<org>/<name> output path used by inspect view bundle publishes a static viewer to a Hugging Face Space instead.
Azure Blob Storage
You can store evaluation logs in Azure Blob Storage using any Azure-compatible fsspec scheme (az://, abfs://, or abfss://). Inspect relies on fsspec + adlfs, so no code changes are needed beyond installing the Azure dependency.
pip install "adlfs>=2025.8.0"Recommended (Managed Identity / Workload Identity)
If running in Azure (App Service, Container Apps, VM, ASK) with a managed identity assigned and granted Storage Blob Data Contributor (or Reader for read‑only), do not set any secret environment variables. The absence of explicit secrets allows adlfs to fall back to DefaultAzureCredential and use the managed identity securely.
Set only the log directory (and optionally the account name for short az:// URIs):
AZURE_STORAGE_ACCOUNT_NAME=myaccount   # optional for abfs*/fully-qualified URIs
INSPECT_LOG_DIR=az://mycontainer/inspect-logs
Explicitly set AZURE_STORAGE_ANON=false. When left unset the default None is interpreted as anonymous access (true), which skips your managed identity or SAS credentials and causes authorization failures.
Or with a fully-qualified Data Lake (hierarchical namespace) URI:
INSPECT_LOG_DIR=abfss://mycontainer@myaccount.dfs.core.windows.net/inspect-logsFallback Credential Options (when managed identity is unavailable)
Order of precedence: SAS Token > Account Key > Connection String.
AZURE_STORAGE_ACCOUNT_NAME=myaccount
# SAS token (scoped, time-bound; omit leading '?')
AZURE_STORAGE_SAS_TOKEN=sv=2024-...&ss=bfqt&srt=...
# Account key (broad permissions; avoid in production)
# AZURE_STORAGE_ACCOUNT_KEY=xxxxxxxxxxxxxxxxxxxxxxxx
# Connection string (legacy, broad)
# AZURE_STORAGE_CONNECTION_STRING=DefaultEndpointsProtocol=...;AccountKey=...;
INSPECT_LOG_DIR=az://mycontainer/inspect-logs
Also set AZURE_STORAGE_ANON=false here—leaving it empty reverts to anonymous mode and adlfs will ignore the credential above.
Running Evaluations & Viewer
inspect eval popularity.py --model openai/gpt-4
inspect view  # streams directly from Azure
For web deployment (App Service / Container Apps), just replicate the same environment variable setup; managed identity remains the most secure pattern.
Log File Name
By default, log files are named using the following convention:
{timestamp}_{task}_{id}Where timestamp is the time the log was created; task is the name of the task the log corresponds to; and id is a unique task id.
The {timestamp} part of the log file name is required to ensure that log files appear in sequential order in the filesystem. However, the rest of the filename can be customized using the INSPECT_EVAL_LOG_FILE_PATTERN environment variable, which can include any combination of task, model, and id fields. For example, to include the model in log file names:
export INSPECT_EVAL_LOG_FILE_PATTERN={task}_{model}_{id}
inspect eval ctf.py
As with other log file oriented environment variables, you may find it convenient to define this in a .env file from the location where you run your evals.
Log Commands
We’ve shown a number of Python functions that let you work with eval logs from code. However, you may be writing an orchestration or visualisation tool in another language (e.g. TypeScript) where its not particularly convenient to call the Python API. The Inspect CLI has a few commands intended to make it easier to work with Inspect logs from other languages:
| Command | Description |
|---|---|
inspect log list |
List all logs in the log directory. |
inspect log dump |
Print log file contents as JSON. |
inspect log convert |
Convert between log file formats. |
inspect log export-config |
Export a run config YAML from a log file. |
inspect log schema |
Print JSON schema for log files. |
Listing Logs
You can use the inspect log list command to enumerate all of the logs for a given log directory. This command will utilise the INSPECT_LOG_DIR if it is set (alternatively you can specify a --log-dir directly). You’ll likely also want to use the --json flag to get more granular and structured information on the log files. For example:
$ inspect log list --json           # uses INSPECT_LOG_DIR
$ inspect log list --json --log-dir ./security_04-07-2024
You can also use the --status option to list only logs with a success or error status:
$ inspect log list --json --status success
$ inspect log list --json --status error
You can use the --retryable option to list only logs that are retryable
$ inspect log list --json --retryableReading Logs
The inspect log list command will return set of URIs to log files which will use a variety of protocols (e.g. file://, s3://, gcs://, etc.). You might be tempted to try to read these URIs directly, however you should always do so using the inspect log dump command for two reasons:
- As described above in Log Format, log files may be stored in binary or text. the
inspect log dumpcommand will print any log file as plain text JSON no matter its underlying format. - Log files can be located on remote storage systems (e.g. Amazon S3) that users have configured read/write credentials for within their Inspect environment, and you’ll want to be sure to take advantage of these credentials.
For example, here we read a local log file and a log file on Amazon S3:
$ inspect log dump file:///home/user/log/logfile.json
$ inspect log dump s3://my-evals-bucket/logfile.json
Converting Logs
You can convert between the two underlying log formats using the inspect log convert command. The convert command takes a source path (with either a log file or a directory of log files) along with two required arguments that specify the conversion (--to and --output-dir). For example:
$ inspect log convert source.json --to eval --output-dir log-outputOr for an entire directory:
$ inspect log convert logs --to eval --output-dir logs-evalLogs that are already in the target format are simply copied to the output directory. By default, log files in the target directory will not be overwritten, however you can add the --overwrite flag to force an overwrite.
Note that the output directory is always required to enforce the practice of not doing conversions that result in side-by-side log files that are identical save for their format.
Exporting Run Config
The inspect log export-config command reads a log file and writes a YAML (or JSON) file that captures the complete configuration used for that run — task, model, model roles, generation parameters, solver, and eval settings. The output can be passed directly to inspect eval --run-config to reproduce the run:
$ inspect log export-config logs/my_run.eval > run.yaml
$ inspect eval --run-config run.yaml
This closes the round-trip: eval → log → export-config → eval. By default output goes to stdout; use --output to write to a file, and --format json for JSON instead of YAML.
See Run Config File for the full schema that --run-config accepts.
Log Schema
Log files are stored in JSON. You can get the JSON schema for the log file format with a call to inspect log schema:
$ inspect log schemaBecause evaluation logs contain lots of numerical data and calculations, it is possible that some number values will be NaN or Inf. These numeric values are supported natively by Python’s JSON parser, however are not supported by the JSON parsers built in to browsers and Node JS.
To correctly read Nan and Inf values from eval logs in JavaScript, we recommend that you use the JSON5 Parser. For other languages, Nan and Inf may be natively supported (if not, see these JSON 5 implementations for other languages).